
You open PageSpeed Insights, see an orange or red number and panic. The score is only one part of the report, and rarely the most useful one.
Here is how to read each block, which thresholds to keep in mind and in what order to fix a WordPress site.
What does PageSpeed Insights measure?
Google’s tool analyses one specific address, not your whole site. It gives two families of results: measurements from real users and a simulation run in a lab.
The official documentation says it runs Lighthouse on four categories: performance, accessibility, best practices and SEO.
What is the difference between field data and lab data?
Field data comes from the Chrome User Experience Report (CrUX). It reflects real visitors, on varied devices and networks, over a 28 day period.
Lab data comes from a simulated test in a controlled environment. It helps with debugging, but can miss problems met in real conditions. Use it to find causes, not to judge the experience.
| Type | Source | Use |
|---|---|---|
| Field | Real visitors, 28 days | Judge the experience people get |
| Lab | Lighthouse simulation | Spot and fix the causes |
If your site has few visits, field data can be missing or limited to the whole domain.
What does the score out of 100 mean?
The score comes from Lighthouse. According to the documentation, 90 to 100 is good, 50 to 89 needs improvement, and under 50 is poor.
It varies from one test to the next, because the network and the server load change. Run the test two or three times and compare trends, not a single number.
Which thresholds should you know?
The Core Web Vitals page gives the “good” thresholds, measured at the 75th percentile of page loads, separately on mobile and desktop.
| Metric | What it measures | Good threshold |
|---|---|---|
| LCP | Loading of the largest element | 2.5 seconds or less |
| INP | Responsiveness to interactions | 200 milliseconds or less |
| CLS | Visual stability | 0.1 or less |
In what order should you read the report?
- Choose mobile: it is the tab where the gaps show most.
- Read the field data: a red metric points to a real problem for your visitors.
- Compare with the lab: it shows the elements that delay loading.
- Open the diagnostics: they list images, scripts and styles to deal with.
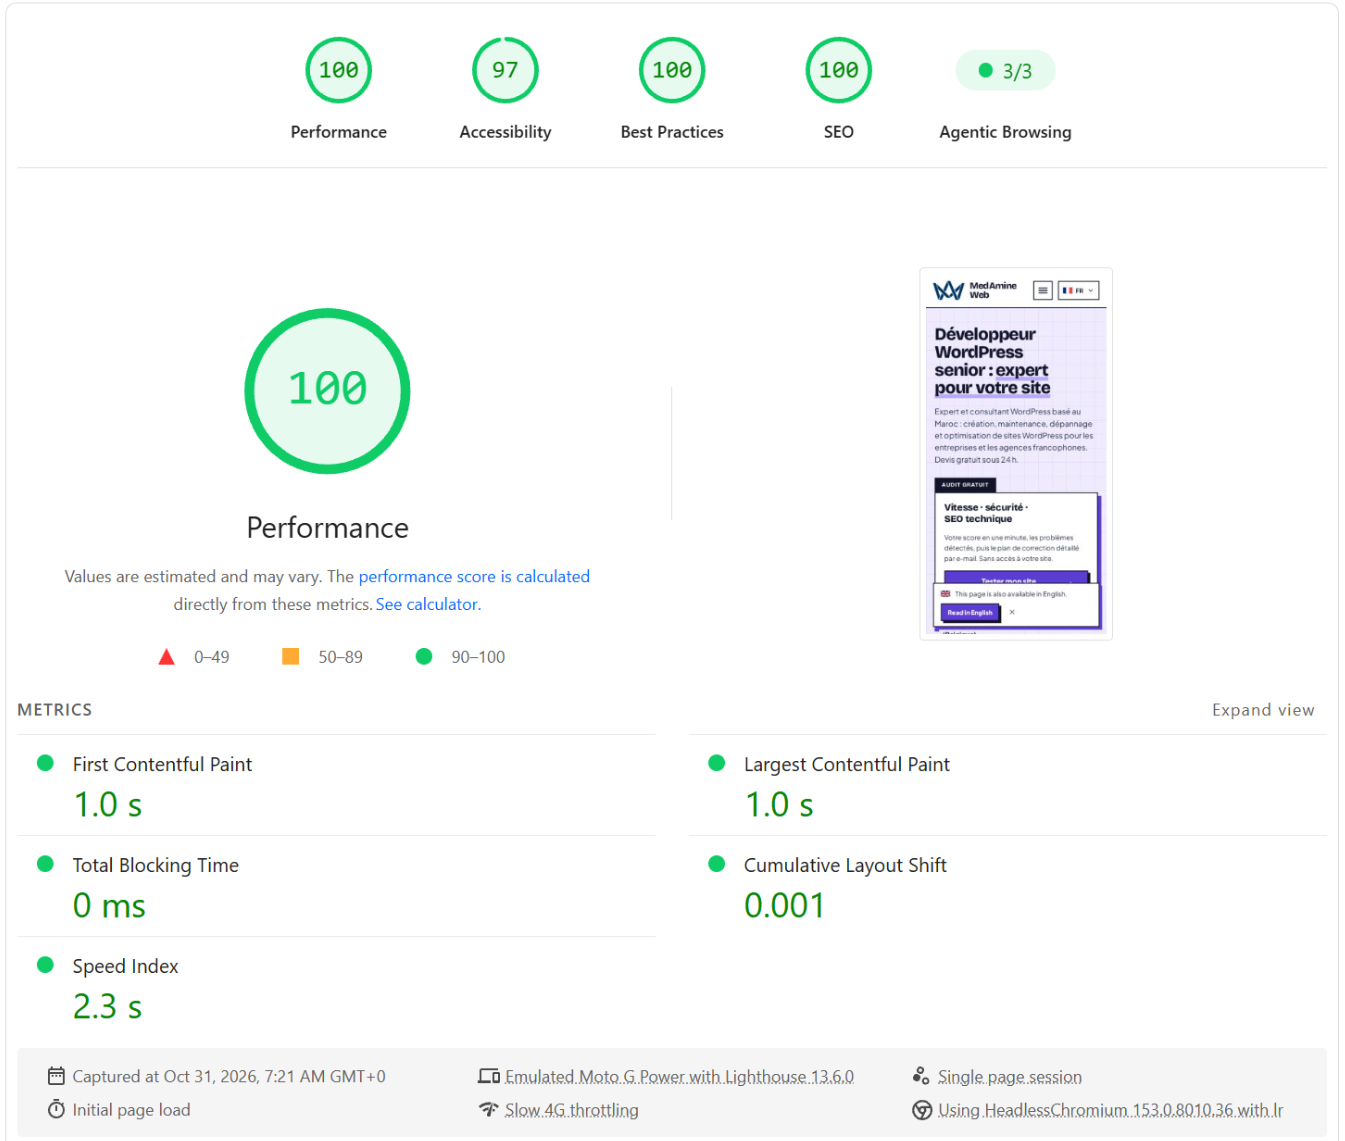
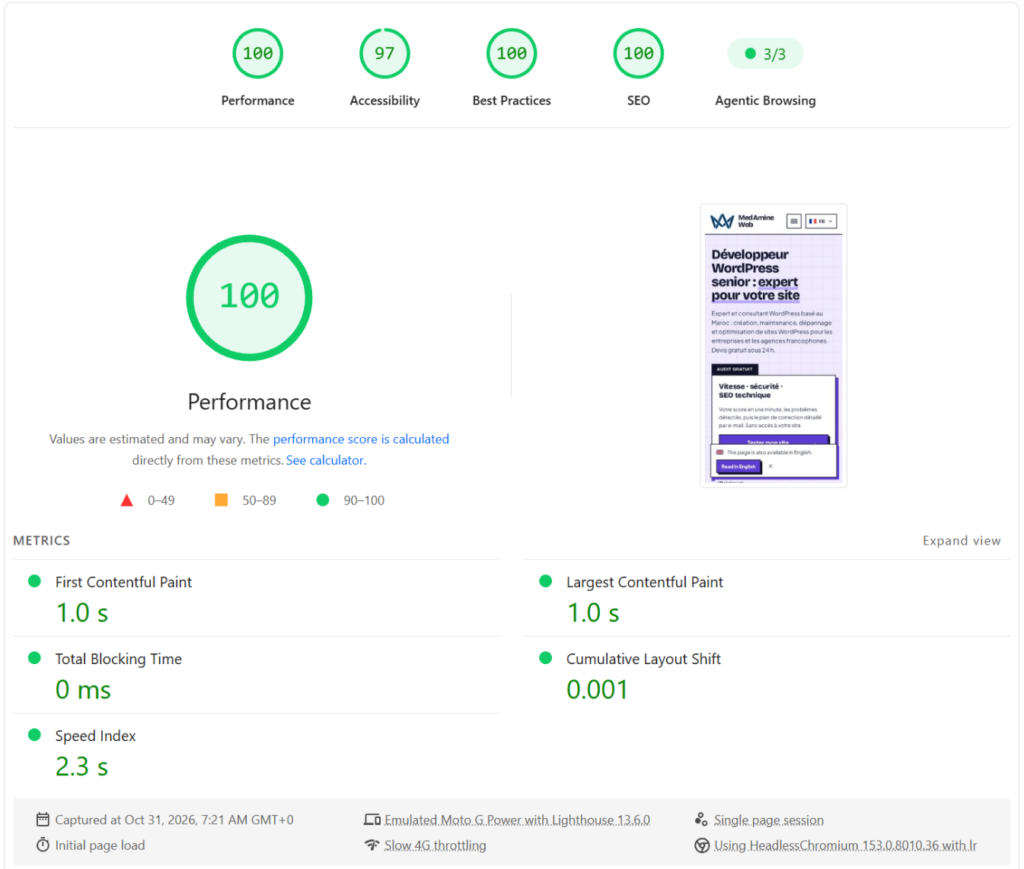
The screenshot shows the report of my home page on mobile. Field data is not available there, for lack of enough visits, so only the lab measurements show. Your own results will differ, and that is normal.
Which misreadings should you avoid?
- Aiming for 100 everywhere: the real gain is small next to the time spent.
- Testing a single page: the home page does not represent the whole site.
- Ignoring field data: a good lab score does not guarantee a good experience.
- Stacking plugins: each addition weighs on loading in turn.
What should you fix first on a WordPress site?
Start with what weighs the most: heavy images, an overloaded theme, the number of plugins and the hosting. Most of the gains come from there.
Each fix costs time. Rank them by expected gain: a two megabyte image at the top of the page weighs more than a script of a few kilobytes, and takes five minutes to fix.
After that, a well tuned cache and a delivery network can help, as I explain in Cloudflare with WordPress. Measure after each change, not after ten.
Does a good score improve search rankings?
Speed contributes to page experience, but it replaces neither content nor relevance. A fast, empty site will not rank better than a useful one.
Google presents these metrics as a measure of the real experience of visitors. A site that answers fast and stays stable while loading reads better, especially on mobile.
Treat speed as comfort for the visitor and one criterion among others. For the rest, follow my technical SEO checklist.
How often should you measure?
Measure after each major change: new theme, new plugin, redesign of the home page. That isolates what slowed the site down.
Between changes, a monthly check is enough. Field data covers 28 days, so an effect does not show overnight.
- After a major update of the theme or of a plugin.
- Before and after adding a tracking tool or an external script.
- Every month, on the three or four pages that get the most visits.
When should you call a professional?
Get help if the LCP stays red despite a cache and optimised images. I offer WordPress speed optimisation with a measured audit before and after.
What now?
What you can do today:
- Test your home page on PageSpeed Insights, on mobile, and note the LCP.
- Run the test three times to see the gap between two measurements.
- Find the heaviest image on the page and check its size.
Dig deeper: WordPress Speed Optimisation